Visualize a position weight matrix as a heatmap or sequence logo
Source:R/plot_ggheatmap.R
viz_pwm.RdThe given position weight matrix is plotted as a heatmap or sequence logo
viz_pwm(
  pwm_mat,
  method = "heatmap",
  pos_lab = NULL,
  pdf_name = NULL,
  fixed_coord = FALSE,
  bits_yax = "full"
)
Arguments
- pwm_mat
Matrix (usually a PWM, but can be any non-normalized matrix) to be visualized. Rownames must be letters.
- method
Character. Set this to 'heatmap' when plotting a heatmap, else you can set it to either of 'custom', 'bits', or 'probability' when you wish to visualize it as a sequence logo. Default is 'heatmap'.
- pos_lab
Labels for sequence positions, should be of same length as that of the sequences. Default value is NULL, when the positions are labeled from 1 to the length of the sequences.
- pdf_name
Name of the file which will be saved as PDF.
- fixed_coord
Set this to TRUE to use a fixed aspect ratio for the plot. Default is FALSE.
- bits_yax
Specify 'full' if the information content y-axis limits should be 0-2 or 'auto' for a suitable limit. The 'auto' setting adjusts the y-axis limits according to the maximum information content of the sequence logo. Default is 'full'.
Value
A ggplot object so you can simply call print or save
on it later. If pdf_name is given, it is also saved and the
ggplot2 object returned.
See also
plot_ggseqlogo_of_seqs for visualizing a collection of
sequences by their sequence logo.
Other visualization functions:
viz_bas_vec(),
viz_seqs_acgt_mat()
Examples
res <- readRDS(system.file("extdata", "example_seqArchRresult.rds",
package = "seqArchR", mustWork = TRUE))
pwm <- seqArchR::make_PWMs(get_clBasVec_m(res,iter=1)[,1],
add_pseudo_counts = FALSE, sinuc = FALSE)
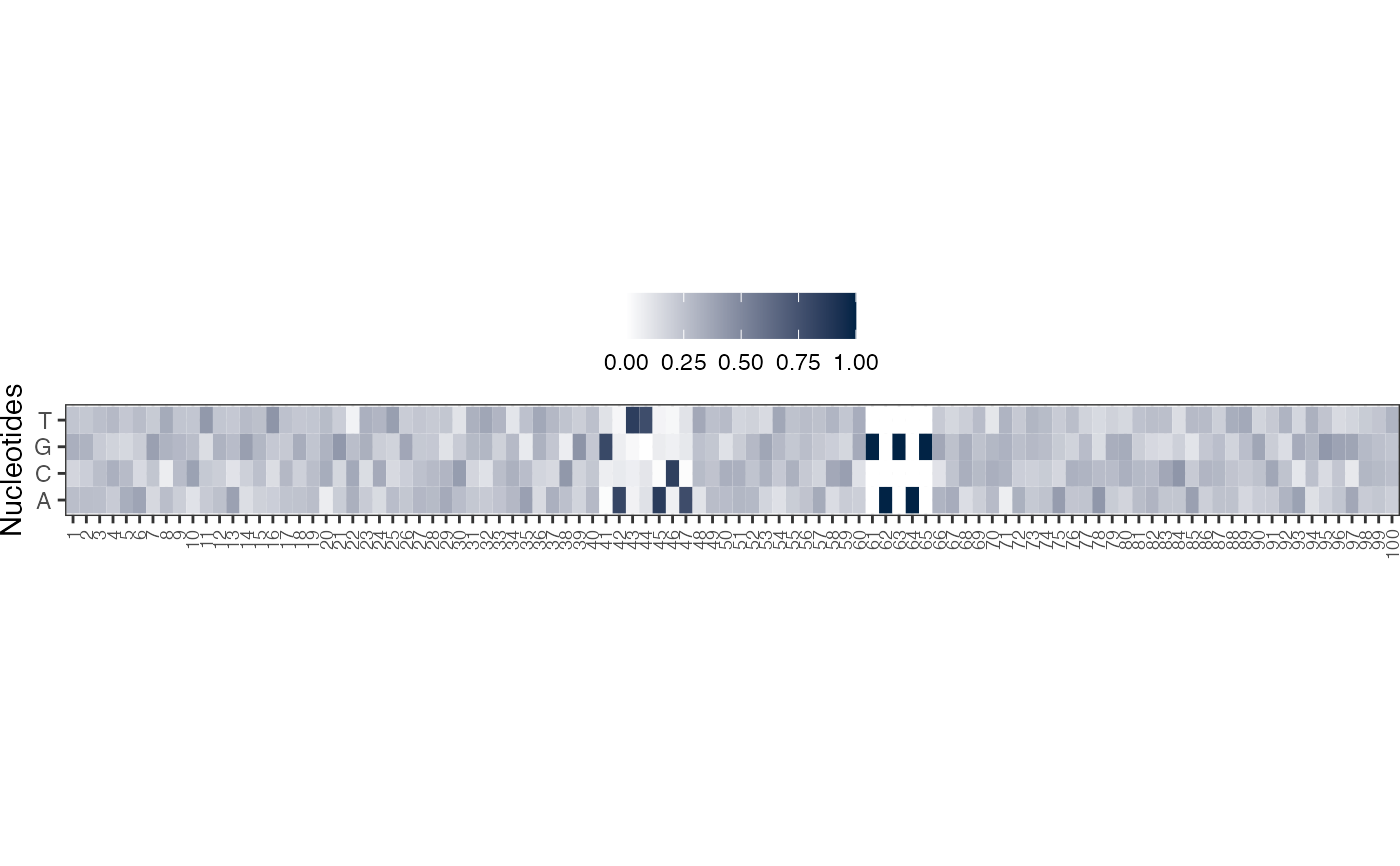
viz_pwm(pwm_mat = pwm, method = "heatmap", fixed_coord = TRUE)
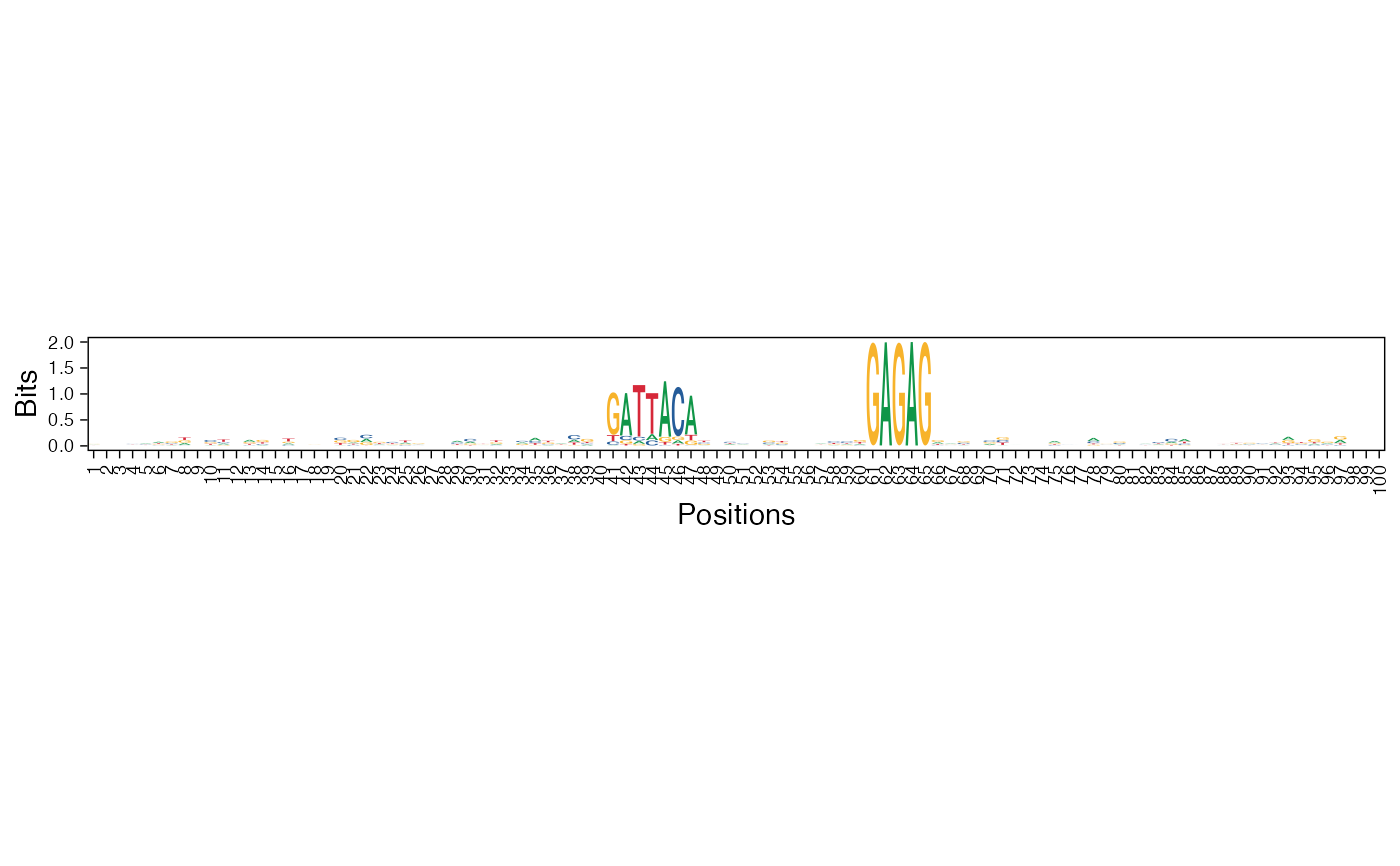
 viz_pwm(pwm_mat = pwm, method = "bits", fixed_coord = TRUE)
#> Scale for x is already present.
#> Adding another scale for x, which will replace the existing scale.
#> Coordinate system already present. Adding new coordinate system, which will
#> replace the existing one.
viz_pwm(pwm_mat = pwm, method = "bits", fixed_coord = TRUE)
#> Scale for x is already present.
#> Adding another scale for x, which will replace the existing scale.
#> Coordinate system already present. Adding new coordinate system, which will
#> replace the existing one.