Plot sequence logo of a collection of sequences
Source:R/plot_arch_for_clusters.R
plot_ggseqlogo_of_seqs.RdA wrapper to ggseqlogo plotting. Given a collection of sequences, this function plots the sequence logo.
plot_ggseqlogo_of_seqs(
  seqs,
  pos_lab = NULL,
  xt_freq = 5,
  method = "bits",
  title = NULL,
  bits_yax = "full",
  fixed_coord = FALSE
)
Arguments
- seqs
Collection of sequences as a
DNAStringSetobject.- pos_lab
Labels for sequence positions, should be of same length as that of the sequences. Default value is NULL, when the positions are labeled from 1 to the length of the sequences.
- xt_freq
Specify the frequency of the x-axis ticks.
- method
Specify either 'bits' for information content or 'prob' for probability.
- title
The title for the plot. Deafult is NULL.
- bits_yax
Specify 'full' if the information content y-axis limits should be 0-2 or 'auto' for a suitable limit. The 'auto' setting adjusts the y-axis limits according to the maximum information content of the sequence logo. Default is 'full'.
- fixed_coord
Specify TRUE if the aspect ratio of the plot should be fixed, FALSE otherwise. Default is TRUE. When `method` argument is set to 'bits', ratio is 4, when 'prob', ratio is 6.
Value
A sequence logo plot of the given DNA sequences.
See also
plot_arch_for_clusters for obtaining multiple
sequence logo plots as a list.
Examples
res <- readRDS(system.file("extdata", "example_seqArchRresult.rds",
package = "seqArchR", mustWork = TRUE))
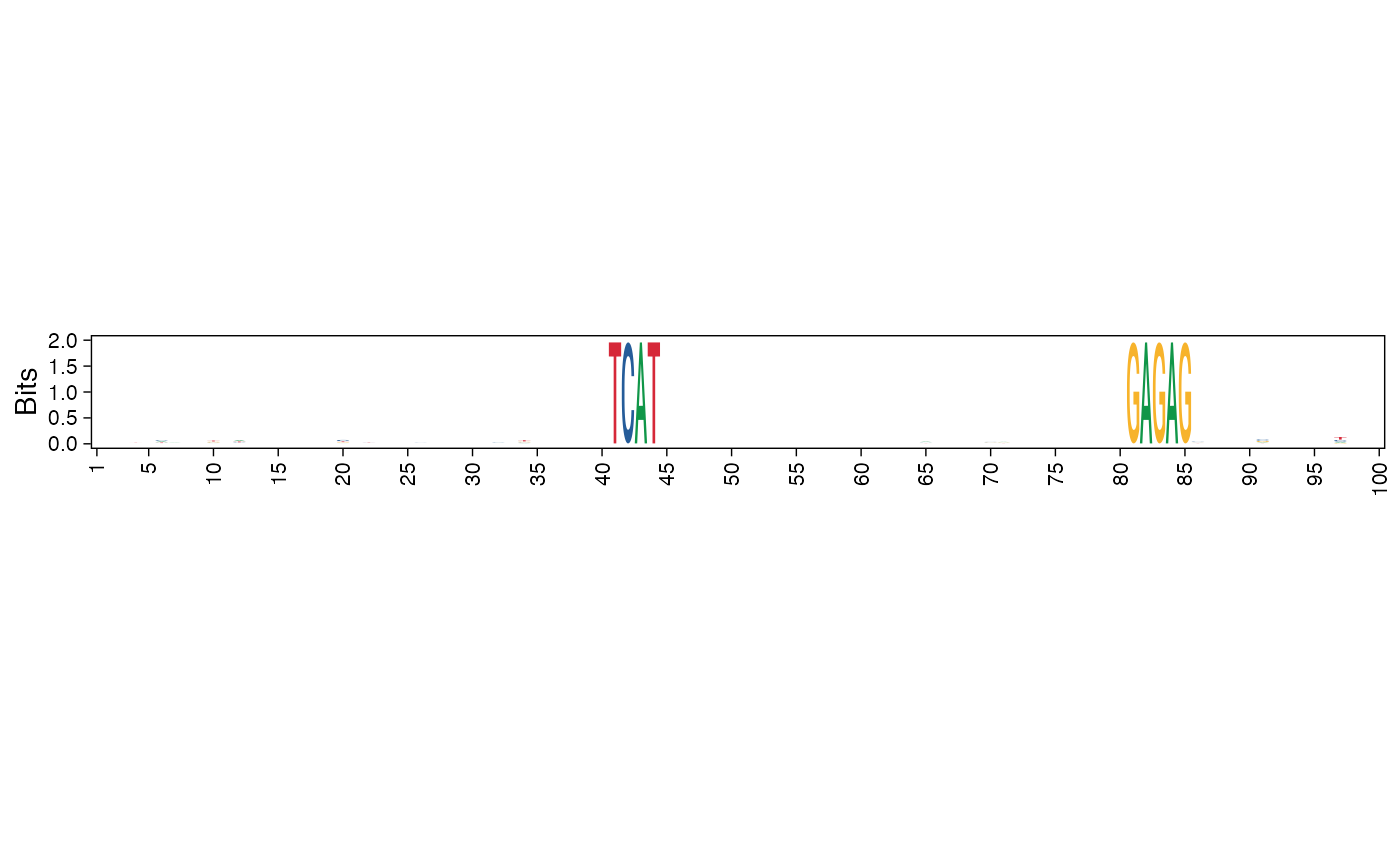
# Default, using information content on y-axis
pl <- plot_ggseqlogo_of_seqs(seqs = seqs_str(res, iter=1, cl=3),
pos_lab = seq_len(100), title = NULL,
fixed_coord = TRUE)
#> Scale for x is already present.
#> Adding another scale for x, which will replace the existing scale.
#> Coordinate system already present. Adding new coordinate system, which will
#> replace the existing one.
pl
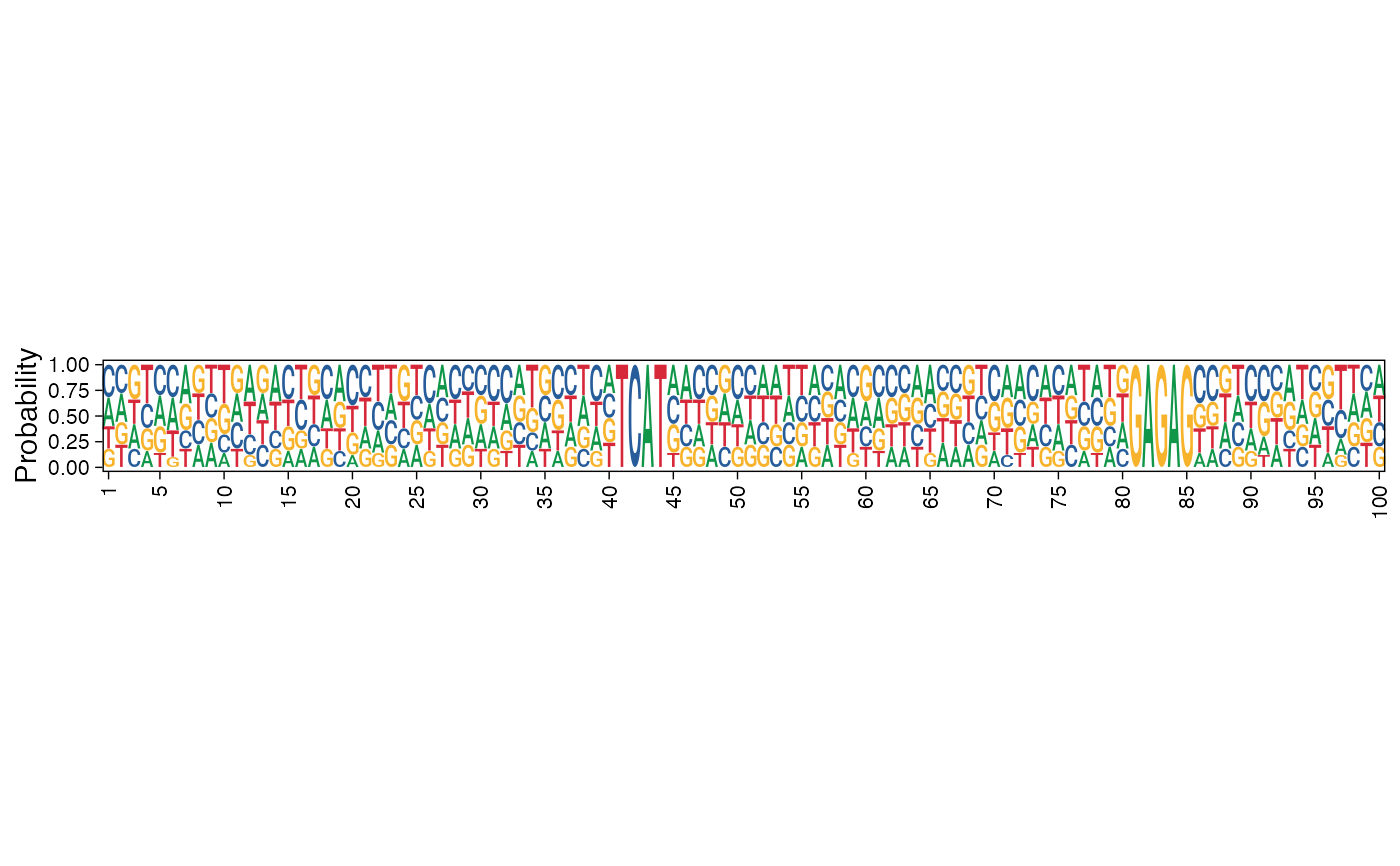
 # Using probability instead of information content
pl <- plot_ggseqlogo_of_seqs(seqs = seqs_str(res, iter=1, cl=3),
pos_lab = seq_len(100), title = "",
method = "prob", fixed_coord = TRUE)
#> Scale for x is already present.
#> Adding another scale for x, which will replace the existing scale.
#> Coordinate system already present. Adding new coordinate system, which will
#> replace the existing one.
#> Plot title:
pl
# Using probability instead of information content
pl <- plot_ggseqlogo_of_seqs(seqs = seqs_str(res, iter=1, cl=3),
pos_lab = seq_len(100), title = "",
method = "prob", fixed_coord = TRUE)
#> Scale for x is already present.
#> Adding another scale for x, which will replace the existing scale.
#> Coordinate system already present. Adding new coordinate system, which will
#> replace the existing one.
#> Plot title:
pl