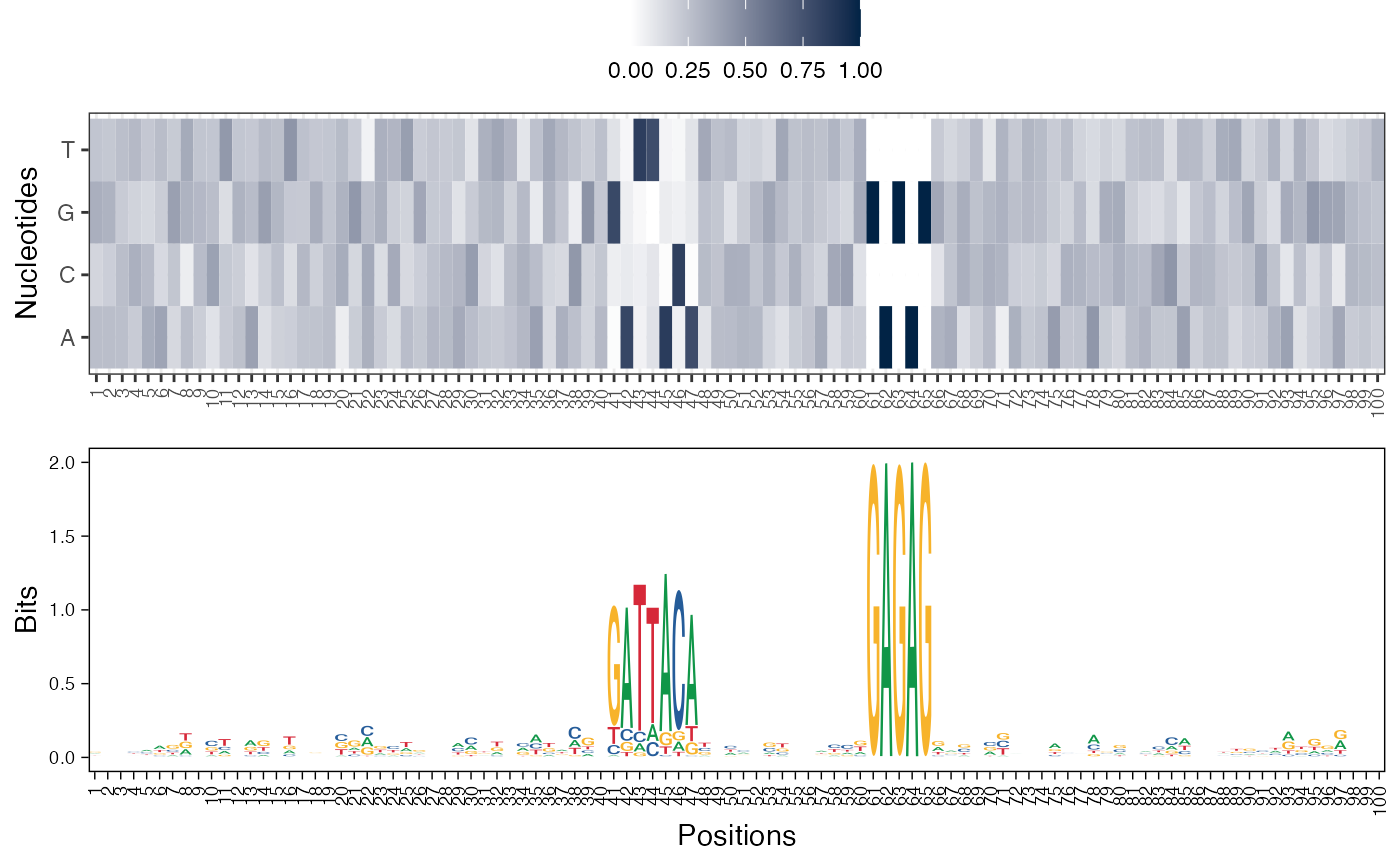
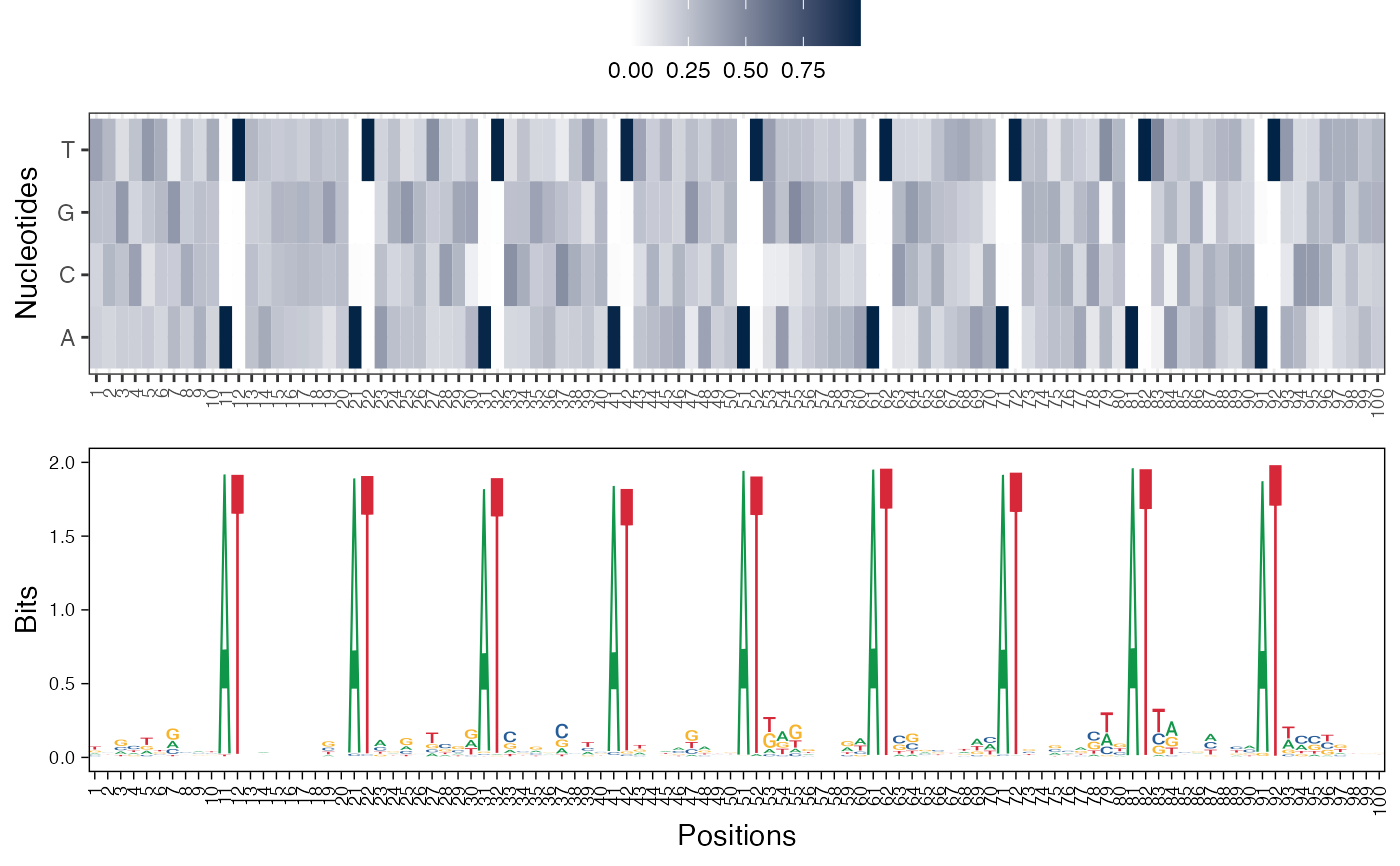
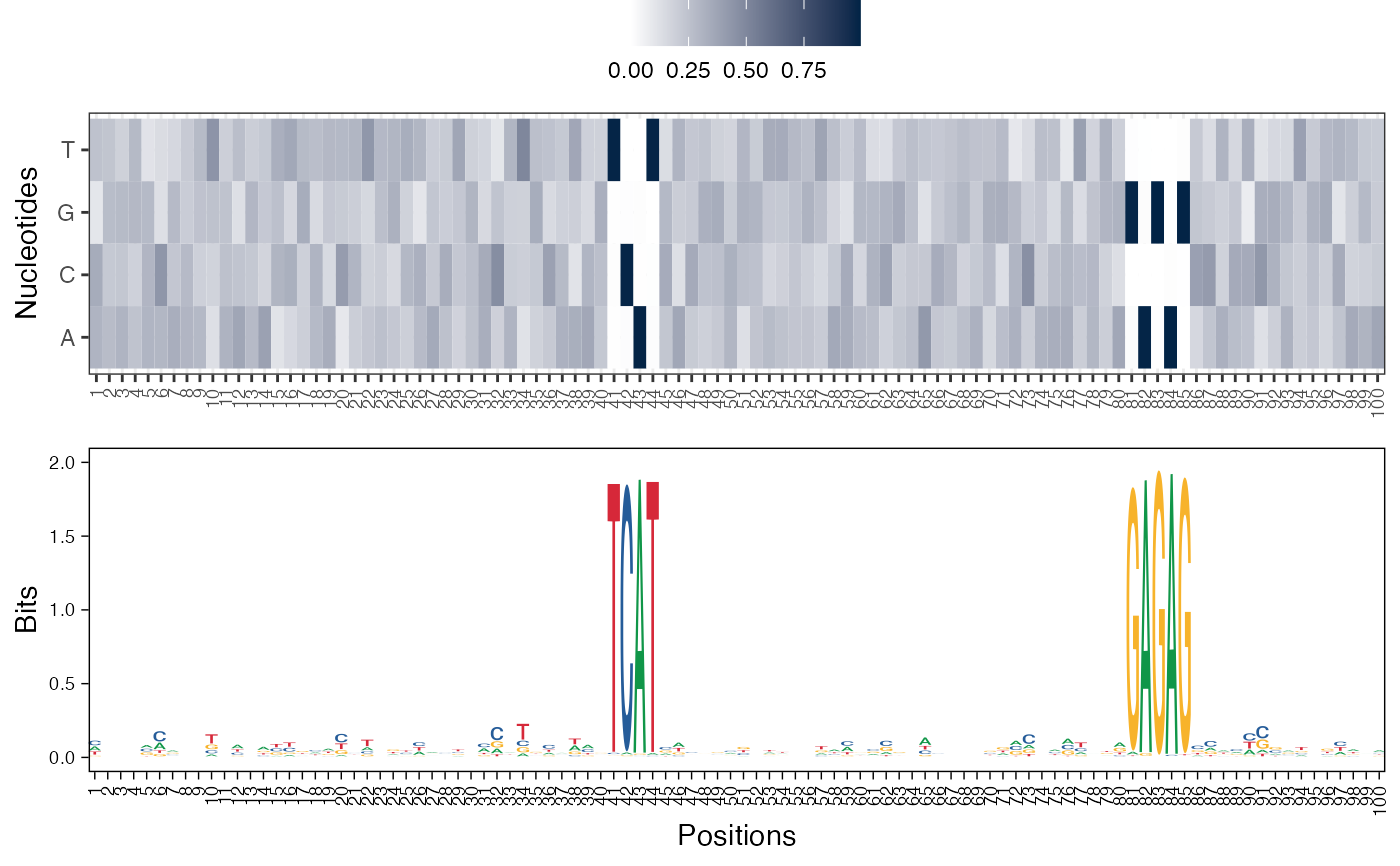
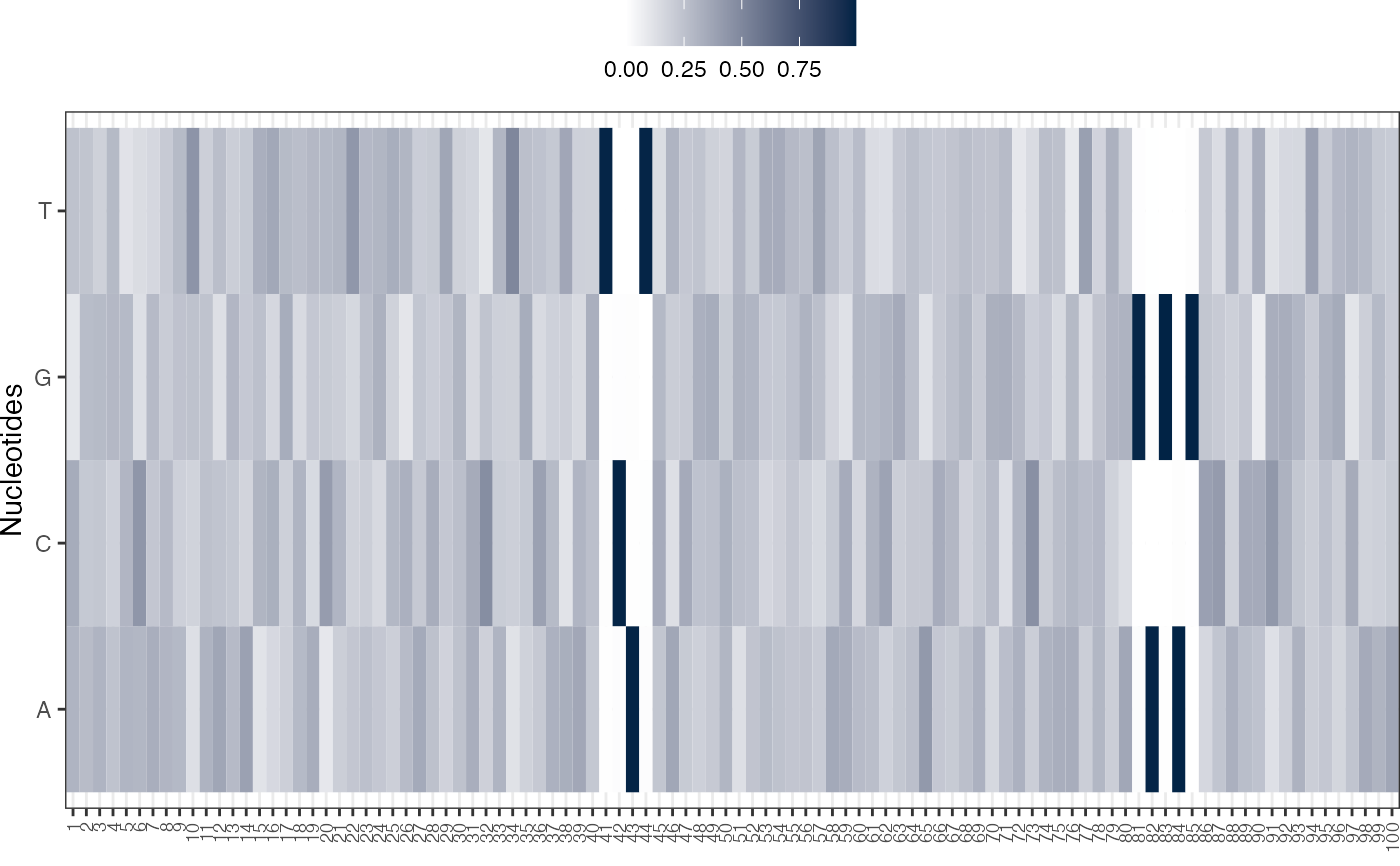
The given features matrix is visualized as a paired heatmap and sequence logo where the positions are aligned for better visualization., or as a single heatmap or as a single sequence logo.
viz_bas_vec(
  feat_mat,
  ptype = c("heatmap", "seqlogo"),
  method = "bits",
  pos_lab = NULL,
  pdf_name = NULL,
  add_pseudo_counts = FALSE,
  sinuc_or_dinuc = "sinuc",
  fixed_coord = FALSE
)
Arguments
- feat_mat
The features matrix (basis vectors matrix) from seqArchR.
- ptype
Character vector of length one or two. Specify just one of "heatmap" or "seqlogo" to visualize the basis vectors as such, or specify a vector of length two for plotting both, heatmap and seqlogo. These are then arranged one below the other, the first on top and the second under it.
- method
Specify either of "custom", "bits", or "probability" for plotting sequence logo. Default is "bits".
- pos_lab
Labels for sequence positions, should be of same length as that of the sequences. Default value is NULL, when the positions are labeled from 1 to the length of the sequences.
- pdf_name
Filename to save the plot, also provide the extension.
- add_pseudo_counts
Logical, taking values TRUE or FALSE, default set to FALSE. Setting it to TRUE will enable adding pseudo-counts to the features matrix.
- sinuc_or_dinuc
"sinuc" or "dinuc" for choosing between mono- and dinucleotide profiles respectively.
- fixed_coord
Set this to TRUE to use a fixed aspect ratio for the plot irrestive of the width and height of the PDF. Default is FALSE.
Value
nothing
See also
Other visualization functions:
viz_pwm(),
viz_seqs_acgt_mat()
Examples
res <- readRDS(system.file("extdata", "example_seqArchRresult.rds",
package = "seqArchR", mustWork = TRUE))
# Visualize basis vectors at iteration 1 of seqArchR result as heatmap and
# sequence logo
viz_bas_vec(feat_mat = get_clBasVec_m(res,iter=1), sinuc_or_dinuc = "dinuc",
ptype = c("heatmap", "seqlogo"))
#> Scale for x is already present.
#> Adding another scale for x, which will replace the existing scale.
#> Scale for x is already present.
#> Adding another scale for x, which will replace the existing scale.
#> Scale for x is already present.
#> Adding another scale for x, which will replace the existing scale.
#> [[1]]
 #>
#> [[2]]
#>
#> [[2]]
 #>
#> [[3]]
#>
#> [[3]]
 #>
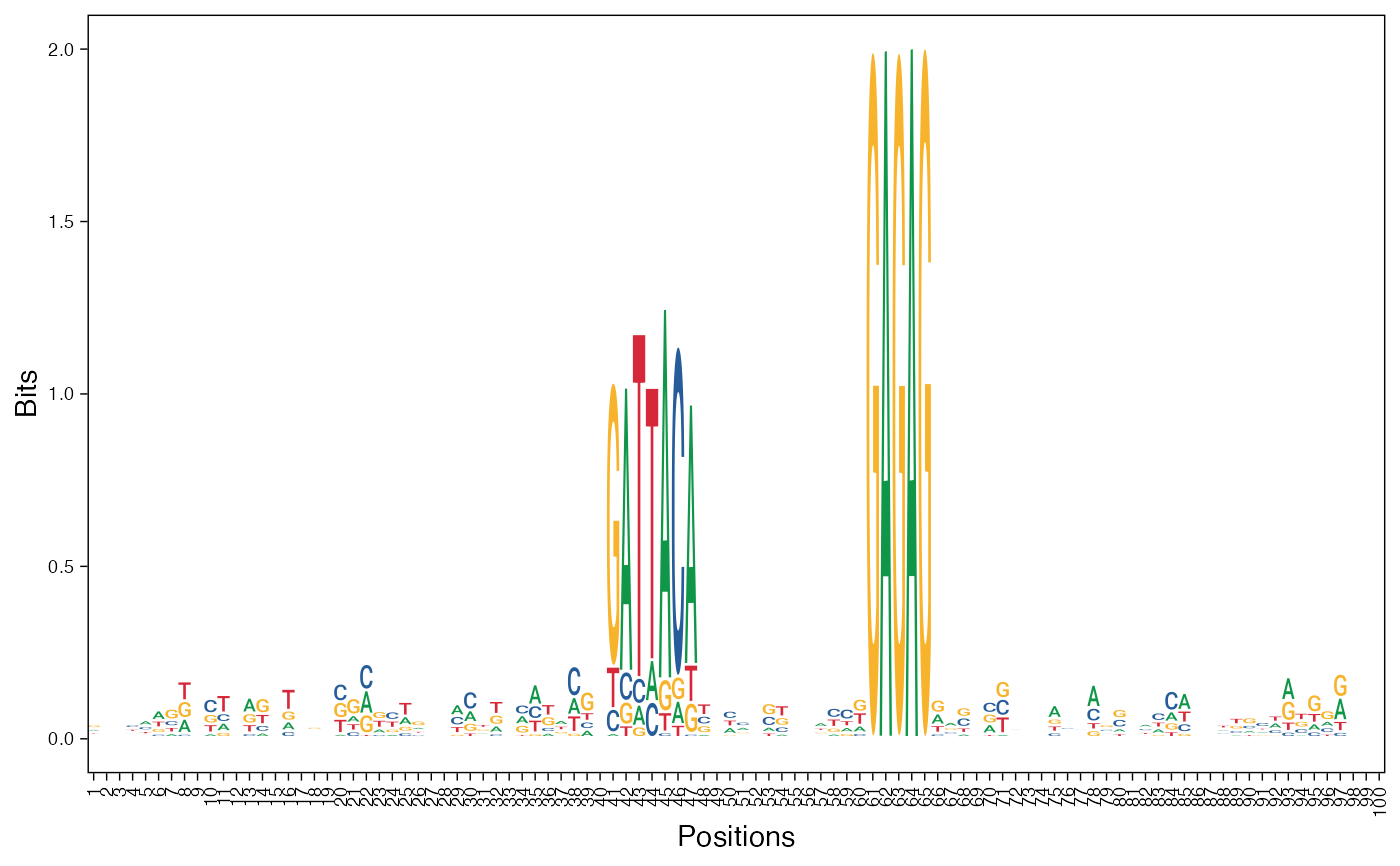
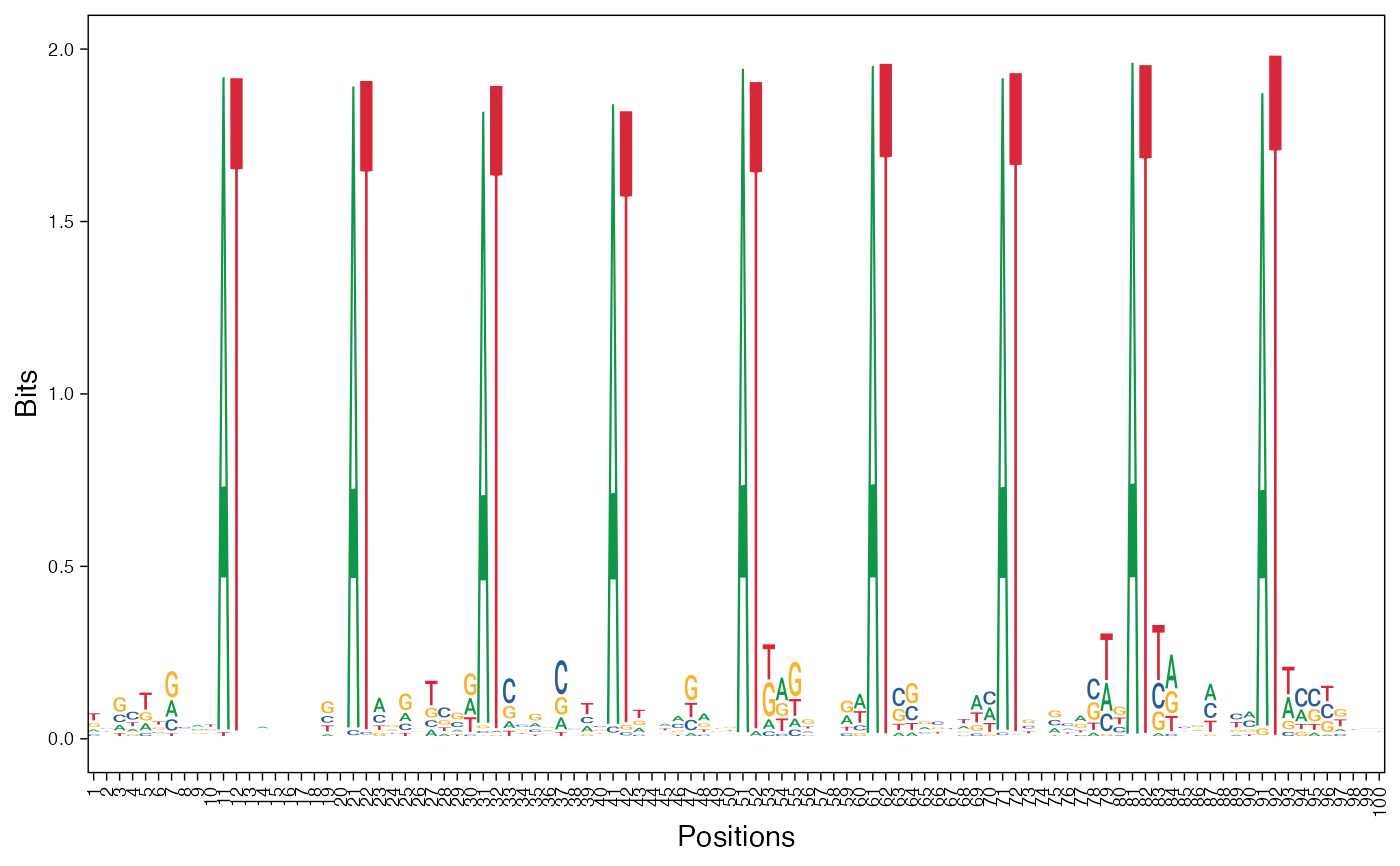
# Visualize basis vectors at iteration 1 of seqArchR result as sequence logos
viz_bas_vec(feat_mat = get_clBasVec_m(res,iter=1), ptype = "seqlogo",
sinuc_or_dinuc = "dinuc")
#> Scale for x is already present.
#> Adding another scale for x, which will replace the existing scale.
#> Scale for x is already present.
#> Adding another scale for x, which will replace the existing scale.
#> Scale for x is already present.
#> Adding another scale for x, which will replace the existing scale.
#> [[1]]
#>
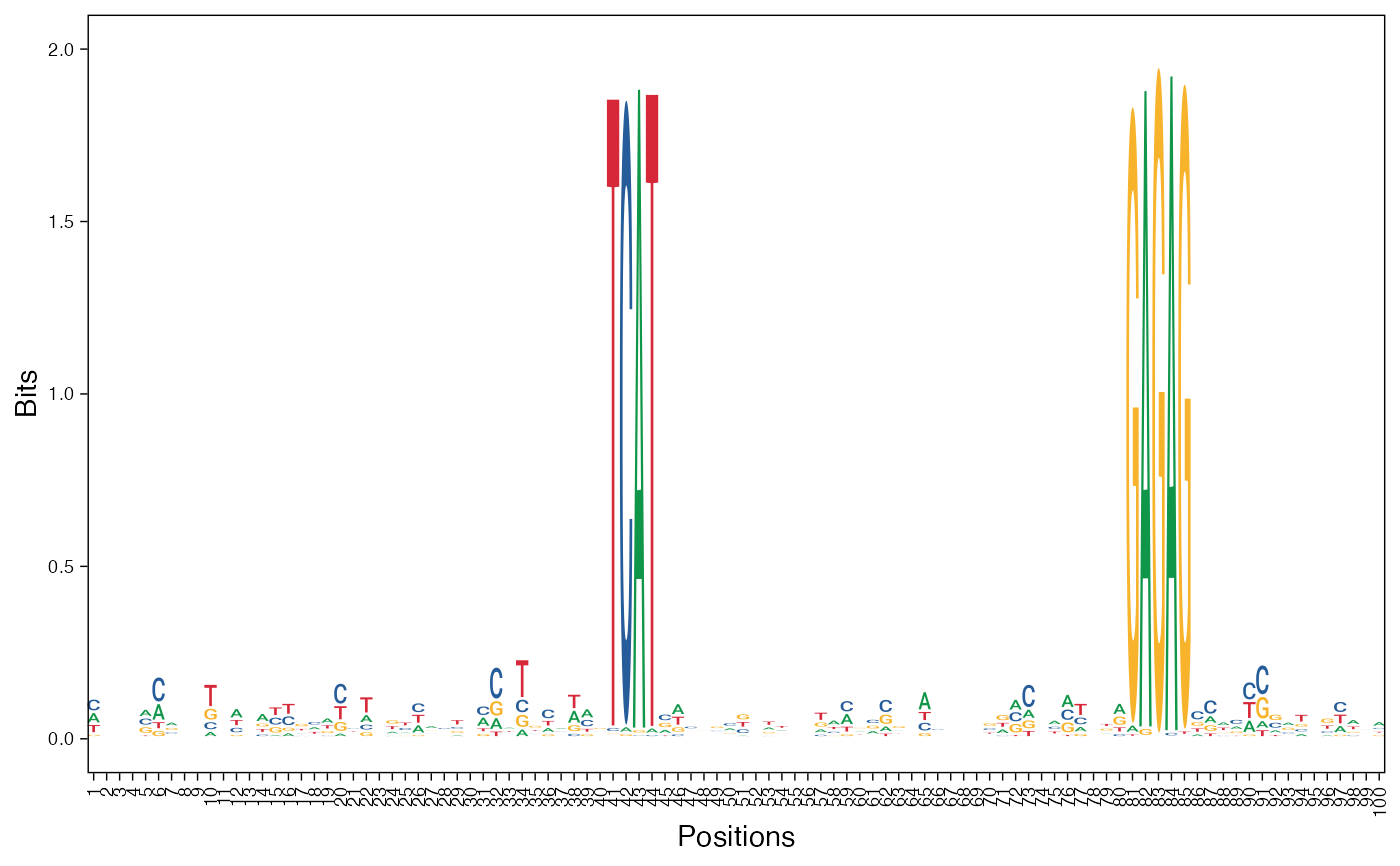
# Visualize basis vectors at iteration 1 of seqArchR result as sequence logos
viz_bas_vec(feat_mat = get_clBasVec_m(res,iter=1), ptype = "seqlogo",
sinuc_or_dinuc = "dinuc")
#> Scale for x is already present.
#> Adding another scale for x, which will replace the existing scale.
#> Scale for x is already present.
#> Adding another scale for x, which will replace the existing scale.
#> Scale for x is already present.
#> Adding another scale for x, which will replace the existing scale.
#> [[1]]
 #>
#> [[2]]
#>
#> [[2]]
 #>
#> [[3]]
#>
#> [[3]]
 #>
# Visualizing basis vector for a single cluster as a heatmap
viz_bas_vec(feat_mat = as.matrix(get_clBasVec_m(res,iter=1)[,3]),
ptype = "heatmap", sinuc_or_dinuc = "dinuc")
#> [[1]]
#>
# Visualizing basis vector for a single cluster as a heatmap
viz_bas_vec(feat_mat = as.matrix(get_clBasVec_m(res,iter=1)[,3]),
ptype = "heatmap", sinuc_or_dinuc = "dinuc")
#> [[1]]
 #>
#>