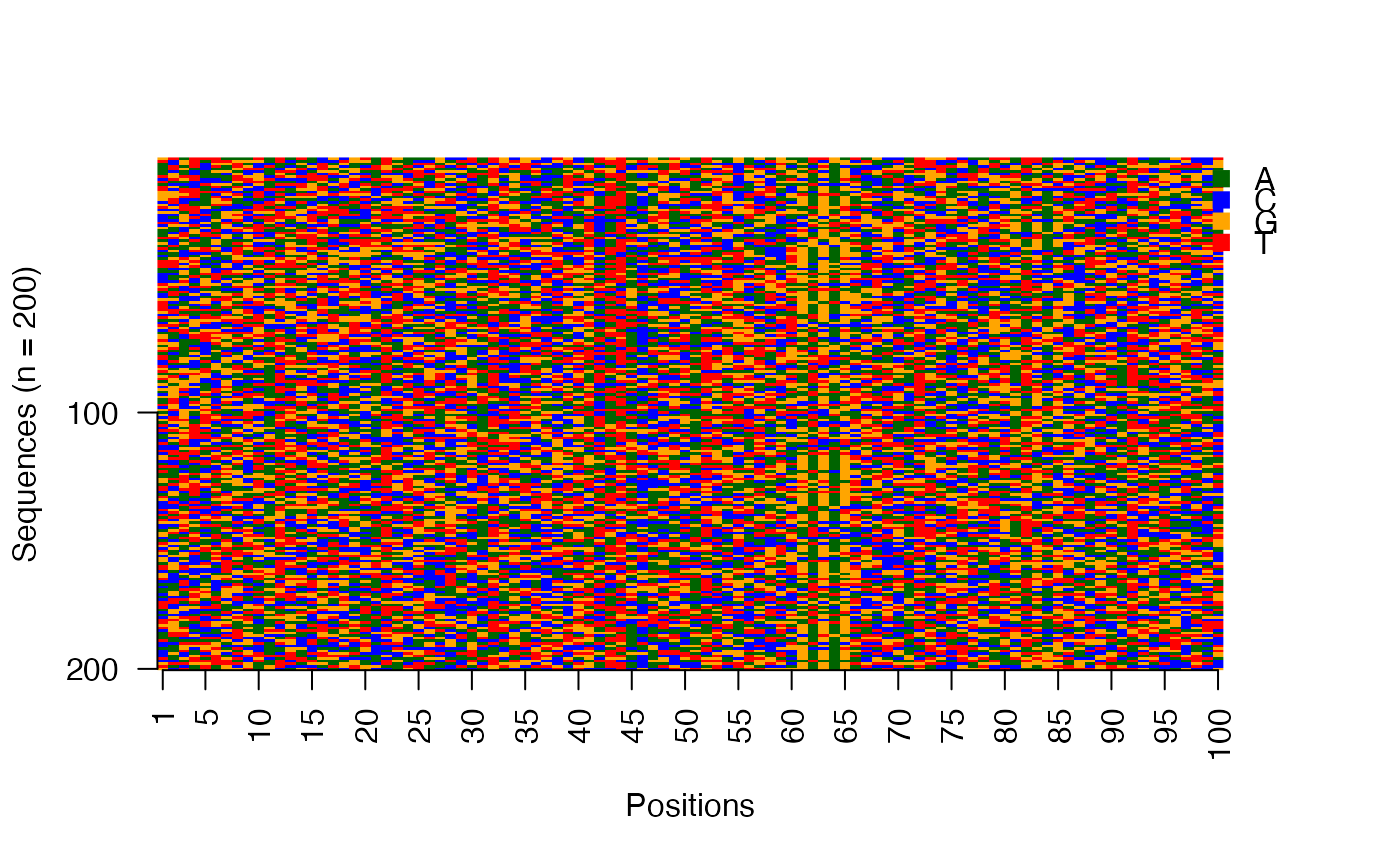
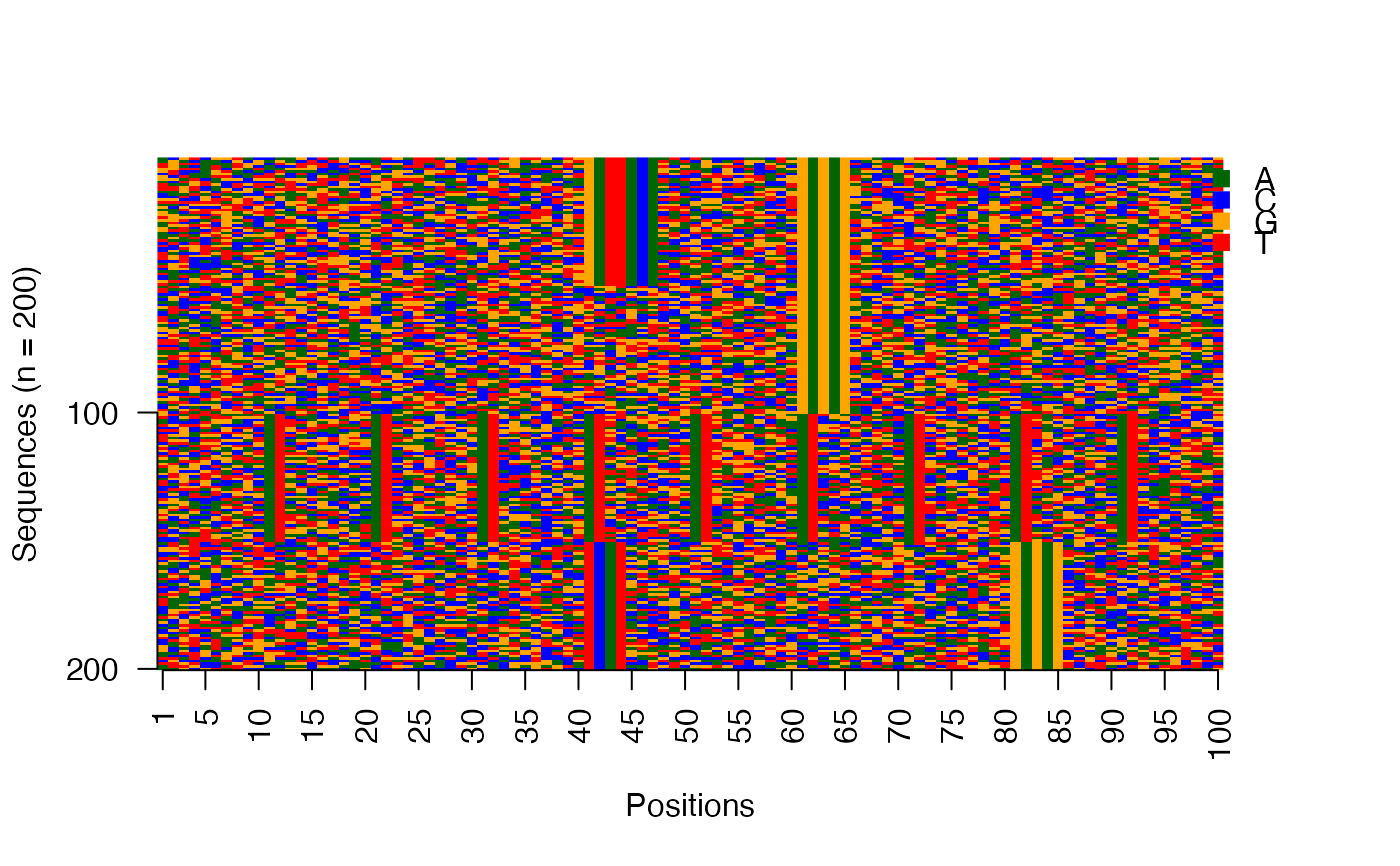
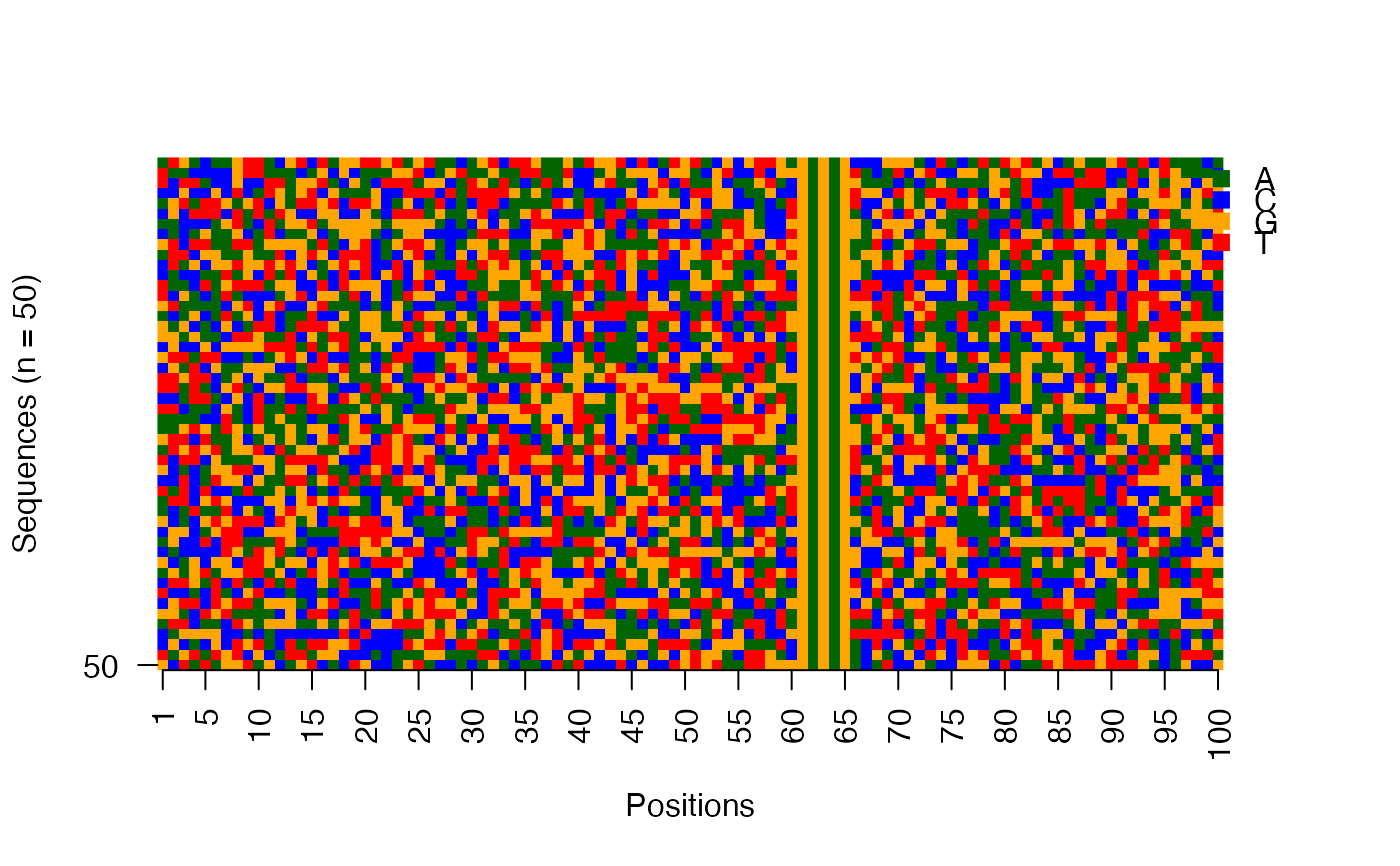
This function plots the collection of sequences as an image matrix.
viz_seqs_acgt_mat(
  seqs,
  pos_lab = NULL,
  xt_freq = min(length(pos_lab), 5),
  yt_freq = min(length(seqs), 100),
  use_col = c("darkgreen", "blue", "orange", "red"),
  add_legend = TRUE,
  use_legend = Biostrings::DNA_BASES,
  save_fname = NULL,
  file_type = "PNG",
  f_width = 450,
  f_height = 900,
  f_units = "px"
)
Arguments
- seqs
The sequences as a DNAStringSet object.
- pos_lab
The labels to be used for the sequence positions. Default: Sequence positions are labeled from 1 to the length of the sequences.
- xt_freq
The x-axis tick frequency. Expects a positive integer less than the length of the sequences. Default is 5.
- yt_freq
The y-axis tick frequency. Expects a positive integer less than number of sequences. Default is 100.
- use_col
A vector of four colors used for the DNA bases A, C, G, and T (in that order).
- add_legend
Logical. Whether legend should be added to the plot. Default is TRUE.
- use_legend
A character vector of letters in the input sequences. Default is
DNA_BASES, used for DNA sequences.- save_fname
Specify the filename (with extension) for saving the plot to disk.
- file_type
Specify the file type, namely PNG, JPEG, TIFF.
- f_width
Specify the width for the plot. This depends on the length of sequences.
- f_height
Specify the height for the plot. This depends on the number of sequences.
- f_units
Specify the units in which the height and width are given.
Value
Nothing returned to the R interpreter.
See also
Other visualization functions:
viz_bas_vec(),
viz_pwm()
Examples
res <- readRDS(system.file("extdata", "example_seqArchRresult.rds",
         package = "seqArchR", mustWork = TRUE))

# Image matrix of sequences in the input order
viz_seqs_acgt_mat(seqs = seqs_str(res))


# Image matrix of sequences ordered by the clustering from seqArchR
use_seqs <- seqs_str(res, iter = NULL, cl = NULL, ord = TRUE)
viz_seqs_acgt_mat(seqs = use_seqs)


# Image matrix of sequences belonging to a single cluster
use_seqs <- seqs_str(res, iter = 2, cl = 2)
viz_seqs_acgt_mat(seqs = use_seqs)
