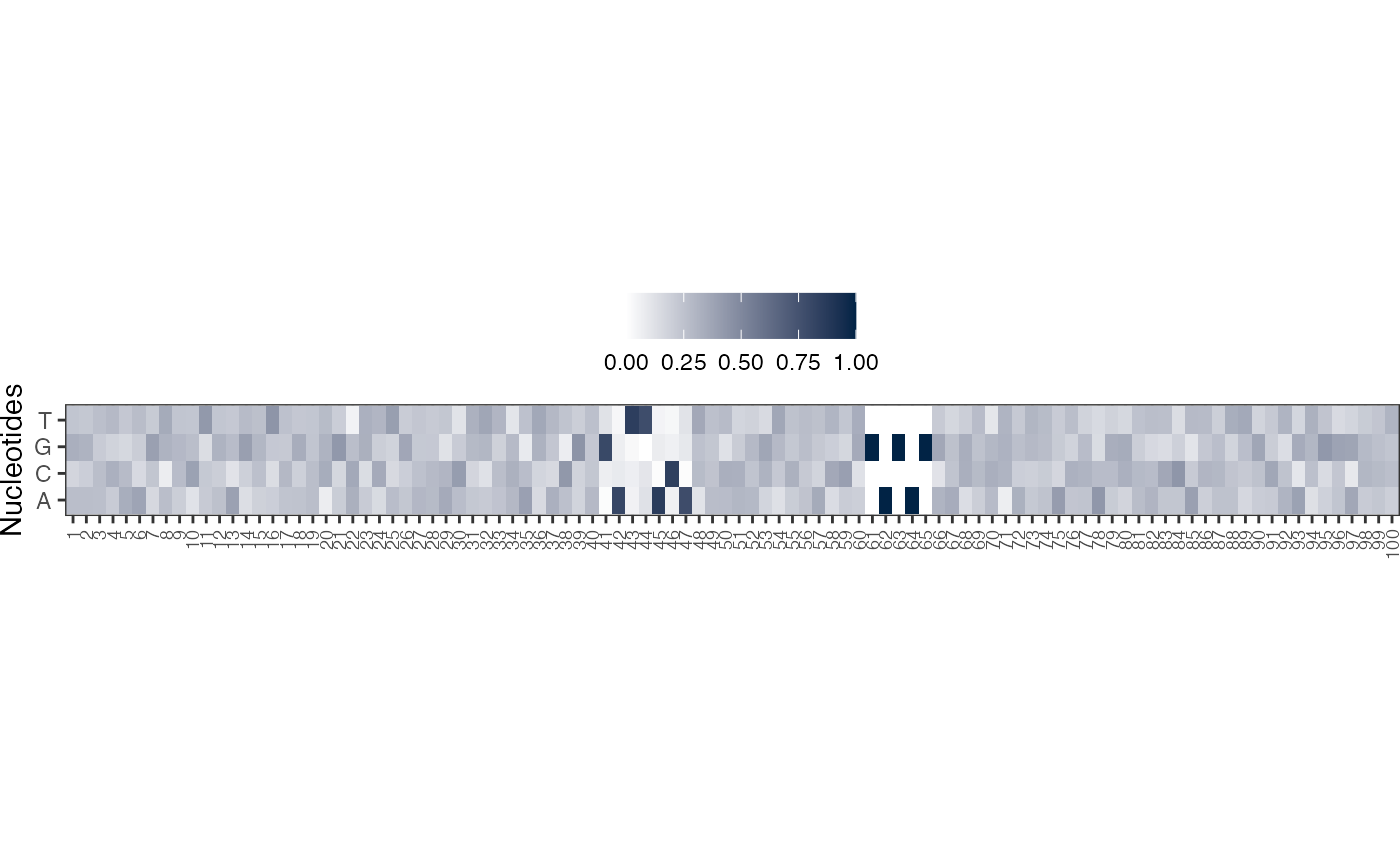
Plot a given position weight matrix as a heatmap using ggplot2
Source:R/plot_ggheatmap.R
plot_ggheatmap.RdThe given matrix is plotted as a heatmap using ggplot2's
geom_tile.
plot_ggheatmap(pwm_mat, pos_lab = NULL, pdf_name = NULL, fixed_coord = FALSE)
Arguments
| pwm_mat | Matrix (usually a PWM, but can be non-normalized/any matrix) to be represented as a heatmap. |
|---|---|
| pos_lab | Labels for sequence positions, should be of same length as that of the sequences. Default value is NULL, when the positions are labeled from 1 to the length of the sequences. |
| pdf_name | Name of the file which will be saved as PDF. |
| fixed_coord | Set this to TRUE to use a fixed aspect ratio for the plot. Default is FALSE. |
Value
A ggplot object so you can simply call print or save
on it later. If pdf_name is given, it is also saved and the
ggplot object returned.
See also
plot_ggseqlogo for plotting PWMs as sequence logos
Other visualization functions:
plot_ggseqlogo(),
viz_bas_vec_heatmap_seqlogo(),
viz_seqs_acgt_mat_from_seqs()
Examples
res <- readRDS(system.file("extdata", "example_archRresult.rds",
         package = "archR", mustWork = TRUE))

pwm <- archR::make_dinuc_PWMs(get_clBasVec_m(res,iter=1)[,1],
                        add_pseudo_counts = FALSE)

plot_ggheatmap(pwm_mat = pwm, fixed_coord = TRUE)