Plot cluster architectures as sequence logos.
Source:R/plot_arch_for_clusters.R
plot_arch_for_clusters.RdGiven a collection of FASTA sequences as a DNAStringSet object, and the clusters information, this function plots the architectures for all clusters. If a name for the PDF file is provided, the resulting set of architecture sequence logos are saved as a multi-page PDF.
plot_arch_for_clusters(
  seqs,
  clust_list,
  pos_lab = NULL,
  xt_freq = 5,
  set_titles = TRUE,
  pdf_width = 11,
  pdf_height = 2,
  pdf_name = NULL,
  show = FALSE,
  ...
)
Arguments
- seqs
Sequences as a
DNAStringSet.- clust_list
Clusters as a list of sequence IDs in each cluster.
- pos_lab
Labels for sequence positions, should be of same length as that of the sequences. Default value is NULL, when the positions are labeled from 1 to the length of the sequences.
- xt_freq
Frequency of x-axis ticks.
- set_titles
Specify TRUE if titles are to be written for the plots. With FALSE, there are no titles for the plots. The title for each plot includes the current cluster number, total number of clusters, start and end sequence numbers in the collection.
- pdf_width, pdf_height
Width and height in inches of the PDF file. Default values are 11 and 2.
- pdf_name
Specify the PDF filename.
- show
Set TRUE if plot should be immediately shown/plotted. Default is TRUE. By setting FALSE, one can simply collect the list of plots and use any other approach to arrange/display them. See examples.
- ...
Additional args passed to
plot_ggseqlogo_of_seqs.
Value
A list of (ggplot2-based) sequence logo plots is returned. When a valid file name is specified, the list of plots is also written to the PDF file (one plot per page).
Examples
res <- readRDS(system.file("extdata", "example_seqArchRresult.rds",
package = "seqArchR", mustWork = TRUE))
# Default position labels 1 to length of the sequences.
# Can also set pos_lab based on biology, e.g., use -50 to 49 denoting
# 50 basepairs upstream and 49 downstream of the transcription start site
# located at position 0.
arch_pl <- plot_arch_for_clusters(seqs = seqs_str(res),
clust_list = res$clustSol$clusters,
pos_lab = NULL,
pdf_name = NULL,
fixed_coord = TRUE)
#> Warning: The `<scale>` argument of `guides()` cannot be `FALSE`. Use "none" instead as
#> of ggplot2 3.3.4.
#> ℹ The deprecated feature was likely used in the ggseqlogo package.
#> Please report the issue at <https://github.com/omarwagih/ggseqlogo/issues>.
#> Scale for x is already present.
#> Adding another scale for x, which will replace the existing scale.
#> Coordinate system already present. Adding new coordinate system, which will
#> replace the existing one.
#> Plot title:(1/3) Arch '1': 100 sequences (1-100)
#> Scale for x is already present.
#> Adding another scale for x, which will replace the existing scale.
#> Coordinate system already present. Adding new coordinate system, which will
#> replace the existing one.
#> Plot title:(2/3) Arch '2': 50 sequences (101-150)
#> Scale for x is already present.
#> Adding another scale for x, which will replace the existing scale.
#> Coordinate system already present. Adding new coordinate system, which will
#> replace the existing one.
#> Plot title:(3/3) Arch '3': 50 sequences (151-200)
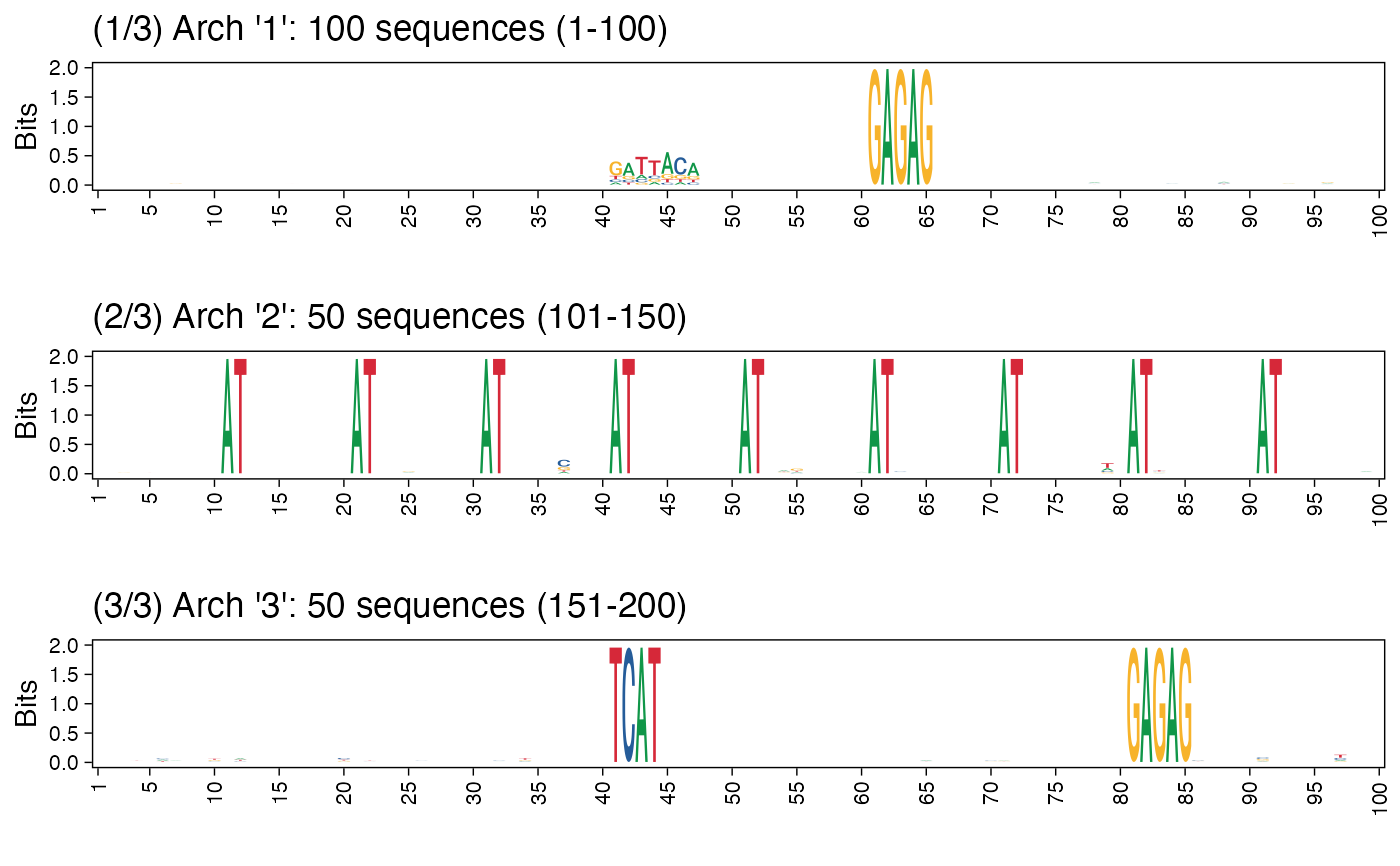
# Using cowplot::plot_grid
arch_pl <- plot_arch_for_clusters(seqs = seqs_str(res),
clust_list = res$clustSol$clusters,
pos_lab = seq(100),
method = "bits",
pdf_name = NULL, show = FALSE)
#> Scale for x is already present.
#> Adding another scale for x, which will replace the existing scale.
#> Plot title:(1/3) Arch '1': 100 sequences (1-100)
#> Scale for x is already present.
#> Adding another scale for x, which will replace the existing scale.
#> Plot title:(2/3) Arch '2': 50 sequences (101-150)
#> Scale for x is already present.
#> Adding another scale for x, which will replace the existing scale.
#> Plot title:(3/3) Arch '3': 50 sequences (151-200)
cowplot::plot_grid(plotlist = arch_pl, ncol=1)
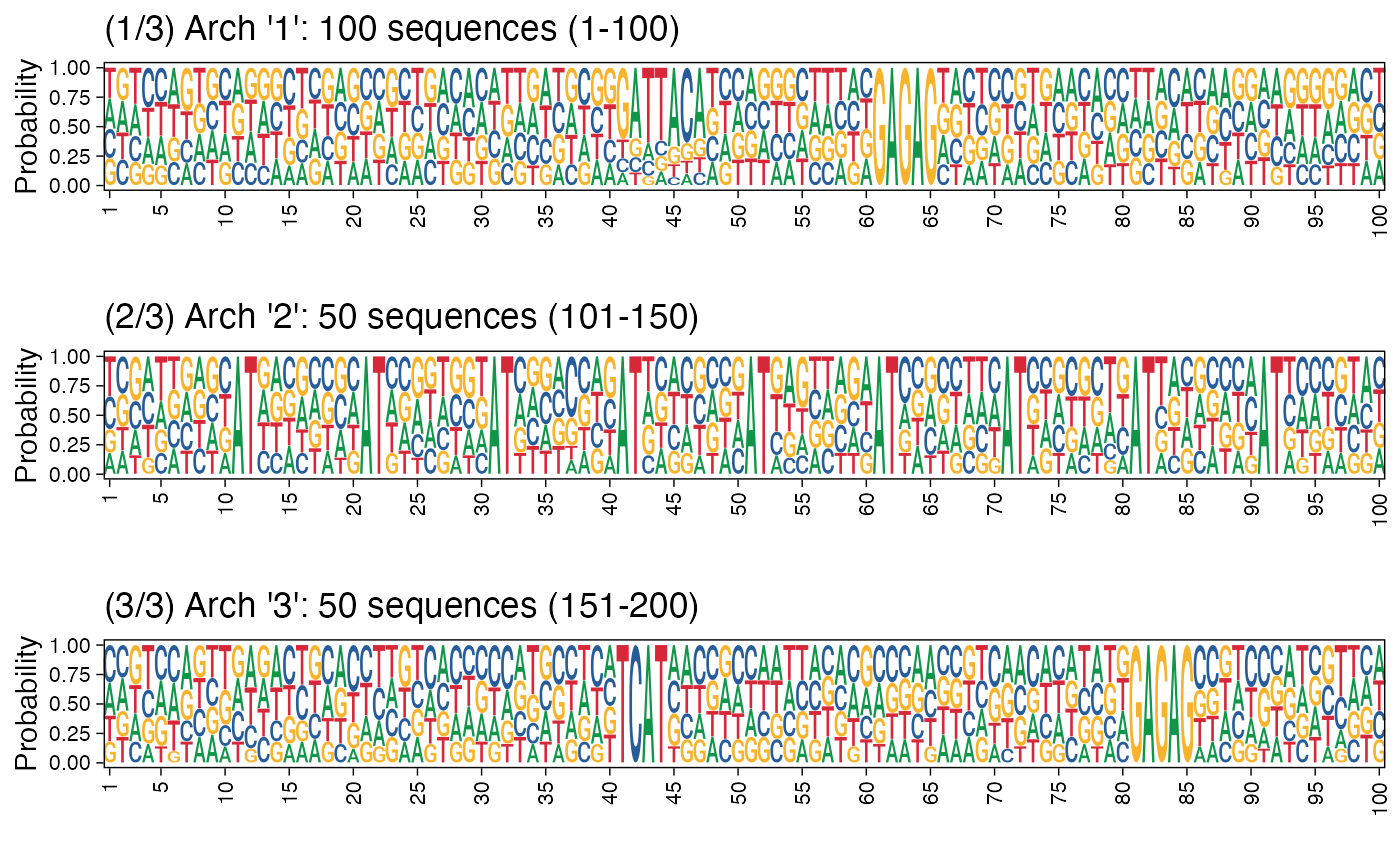
 # Plotting architecture sequence logos with probability instead of
# information content
arch_pl <- plot_arch_for_clusters(seqs = seqs_str(res),
clust_list = res$clustSol$clusters,
pos_lab = seq(100),
method = "prob",
pdf_name = NULL, show = FALSE)
#> Scale for x is already present.
#> Adding another scale for x, which will replace the existing scale.
#> Plot title:(1/3) Arch '1': 100 sequences (1-100)
#> Scale for x is already present.
#> Adding another scale for x, which will replace the existing scale.
#> Plot title:(2/3) Arch '2': 50 sequences (101-150)
#> Scale for x is already present.
#> Adding another scale for x, which will replace the existing scale.
#> Plot title:(3/3) Arch '3': 50 sequences (151-200)
cowplot::plot_grid(plotlist = arch_pl, ncol=1)
# Plotting architecture sequence logos with probability instead of
# information content
arch_pl <- plot_arch_for_clusters(seqs = seqs_str(res),
clust_list = res$clustSol$clusters,
pos_lab = seq(100),
method = "prob",
pdf_name = NULL, show = FALSE)
#> Scale for x is already present.
#> Adding another scale for x, which will replace the existing scale.
#> Plot title:(1/3) Arch '1': 100 sequences (1-100)
#> Scale for x is already present.
#> Adding another scale for x, which will replace the existing scale.
#> Plot title:(2/3) Arch '2': 50 sequences (101-150)
#> Scale for x is already present.
#> Adding another scale for x, which will replace the existing scale.
#> Plot title:(3/3) Arch '3': 50 sequences (151-200)
cowplot::plot_grid(plotlist = arch_pl, ncol=1)